Team ELO
1434ELO#20/ 30
Next game
Player projections assume each player plays.
Slate updated
At this update: No injury report for this date yet. Chances are based on past games only.
 Giannis AntetokounmpoPTS30.3REB11.1AST5.9MIN32.5
 Bam AdebayoPTS18.0REB9.3AST4.3MIN31.9
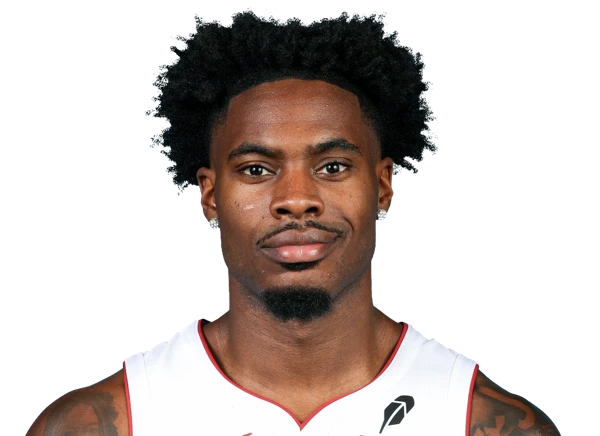 Davion MitchellPTS16.8REB2.9AST6.5MIN33.8
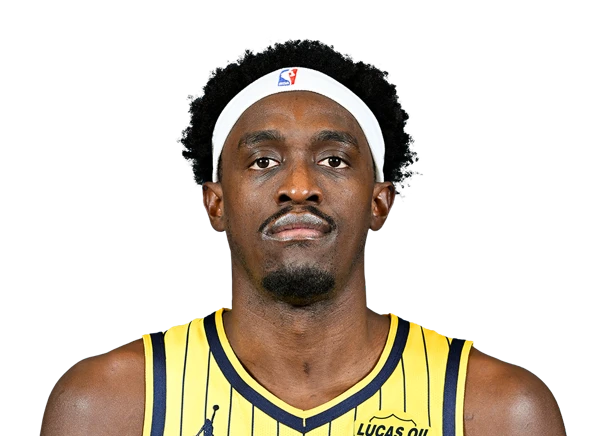 Pascal SiakamPTS24.8REB7.3AST4.1MIN32.0
 Tyrese HaliburtonPTS20.8REB4.7AST7.9MIN32.6
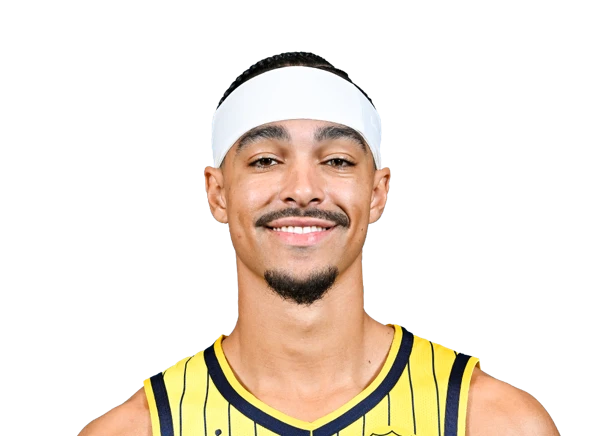 Andrew NembhardPTS14.7REB2.9AST7.3MIN30.6
This game has started. Find the latest published forecast on the projections page.
Explore projectionsPerformance
2026-27 · 4 regular-season games
10 latest games · All competitions · Apr 04 to Oct 26, 2026
Ratings use box-score possession estimates. Lower defense is better; pace describes playing speed.
Two views of team strength
ELO measures team strength from game results. Roster AUGUR combines player impact using expected minutes, relative to the league roster average. The league reference is 0.00 points per 100 possessions; positive is above average and negative is below. These are different measures, with separate update dates; roster AUGUR is not a next-game forecast.
Current squad · 18 players
| Player | Giannis AntetokounmpoPF | Davion MitchellPG | Bam AdebayoC |  Bobby PortisC | 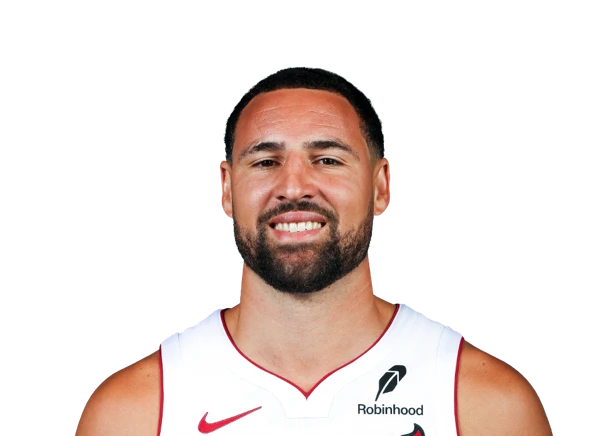 Klay ThompsonSF |  Pelle LarssonSG |  Andrew WigginsSF | 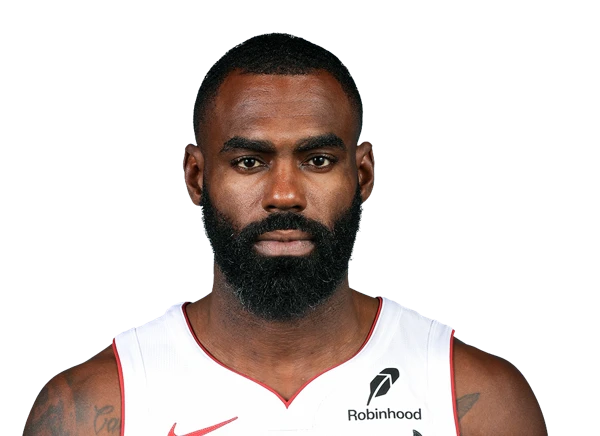 Tim Hardaway Jr.SG | 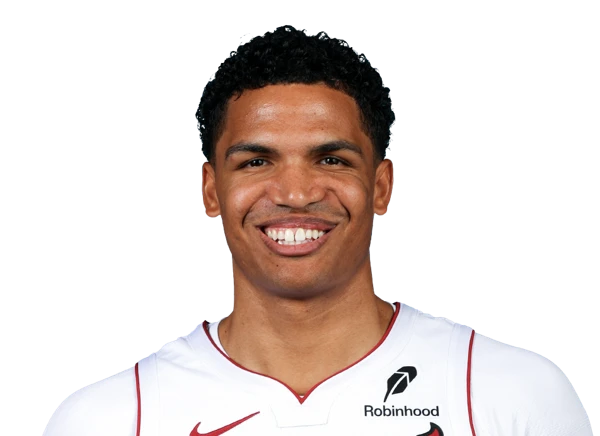 Dru SmithSG | 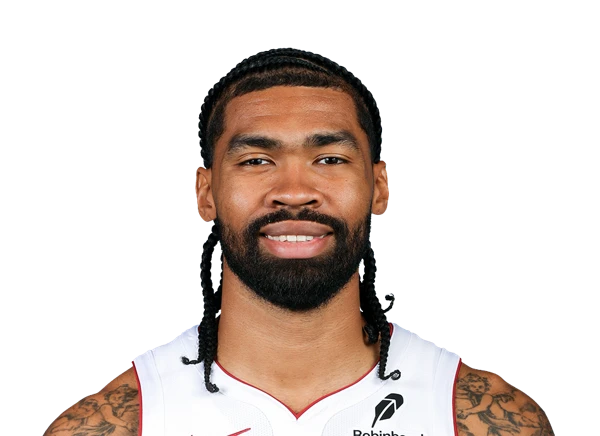 Nick RichardsC |  Nikola JovićPF | 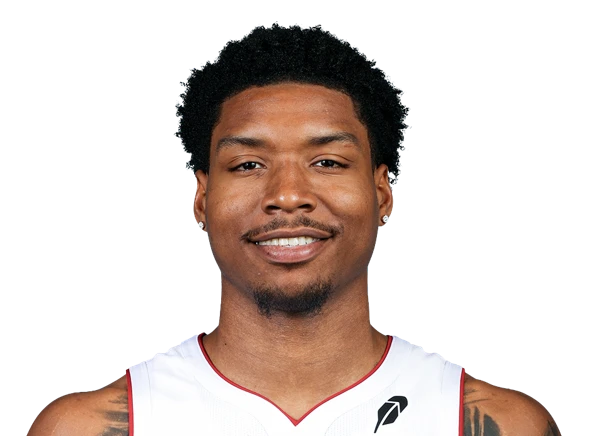 Myron GardnerSF |  Ryan Conwell |  Simone FontecchioSF |  Jahmir YoungPG | 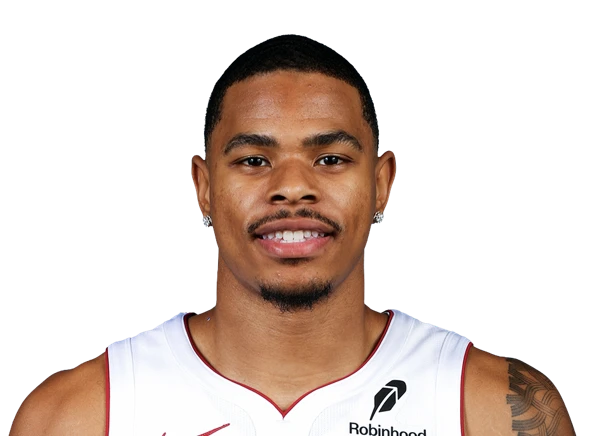 Keshad JohnsonSF | 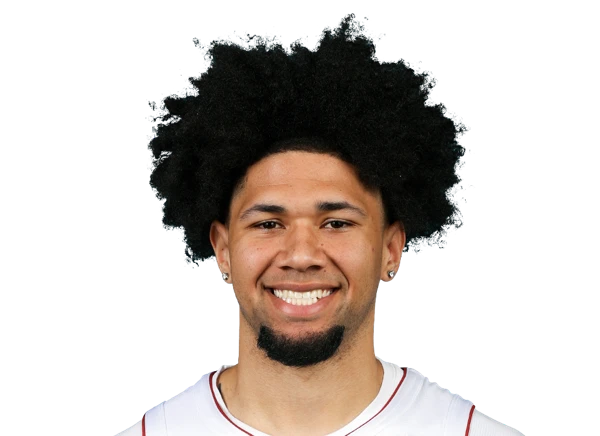 Tre Donaldson | 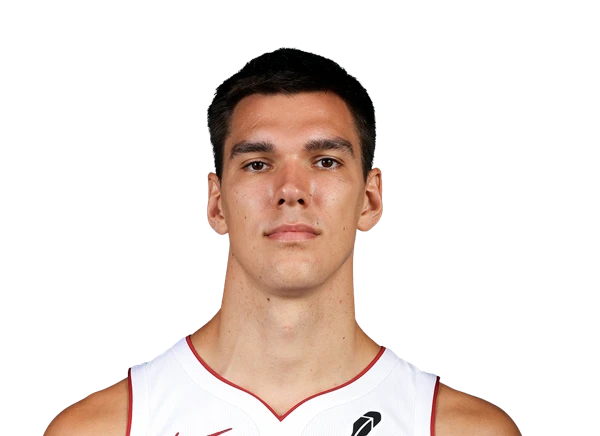 Vladislav GoldinC |
|---|---|---|---|---|---|---|---|---|---|---|---|---|---|---|---|---|---|---|
| 28.5 | 18.0 | 11.8 | 10.2 | 9.0 | 9.0 | 8.8 | 5.2 | 4.5 | 3.5 | 3.0 | 2.0 | 1.7 | 0.0 | N/A | N/A | N/A | N/A | |
| 9.5 | 0.8 | 7.2 | 8.0 | 1.8 | 3.0 | 3.5 | 2.5 | 1.0 | 0.5 | 3.3 | 1.0 | 0.3 | 0.5 | N/A | N/A | N/A | N/A | |
| 5.0 | 7.0 | 3.5 | 1.2 | 0.8 | 3.2 | 1.2 | 0.8 | 1.0 | 0.5 | 1.0 | 0.0 | 0.7 | 0.0 | N/A | N/A | N/A | N/A | |
| 31.6 | 34.1 | 30.7 | 24.2 | 20.7 | 30.7 | 26.3 | 19.0 | 10.1 | 2.9 | 14.6 | 2.9 | 3.2 | 2.9 | N/A | N/A | N/A | N/A | |
| 4 | 4 | 4 | 4 | 4 | 4 | 4 | 4 | 2 | 2 | 3 | 2 | 3 | 2 | N/A | N/A | N/A | N/A | |
| 1.0 | 1.0 | 2.0 | 1.0 | 0.2 | 1.5 | 0.5 | 0.5 | 0.5 | 0.0 | 0.3 | 0.0 | 0.0 | 0.0 | N/A | N/A | N/A | N/A | |
| 0.5 | 0.8 | 0.8 | 0.8 | 0.0 | 0.2 | 0.5 | 0.5 | 0.0 | 0.0 | 0.7 | 0.5 | 0.0 | 0.5 | N/A | N/A | N/A | N/A | |
| 3.5 | 3.0 | 2.0 | 1.5 | 0.8 | 0.8 | 1.0 | 0.8 | 0.5 | 0.0 | 0.7 | 0.5 | 0.0 | 0.0 | N/A | N/A | N/A | N/A | |
| 3.5 | 3.0 | 2.2 | 2.0 | 2.8 | 2.8 | 1.5 | 1.5 | 2.0 | 0.0 | 1.3 | 0.5 | 0.3 | 0.5 | N/A | N/A | N/A | N/A | |
| -13.8 | -13.5 | -12.2 | +4.0 | -14.0 | -2.5 | -18.0 | +1.5 | +5.5 | +3.0 | -2.7 | +3.0 | -0.7 | +3.0 | N/A | N/A | N/A | N/A | |
| 11.0 / 19.8 | 6.8 / 12.5 | 4.5 / 11.2 | 3.5 / 9.0 | 3.0 / 9.2 | 2.2 / 6.0 | 4.0 / 10.0 | 1.2 / 6.2 | 1.5 / 2.0 | 1.5 / 1.5 | 1.0 / 3.3 | 0.0 / 0.0 | 0.7 / 1.7 | 0.0 / 1.5 | N/A / N/A | N/A / N/A | N/A / N/A | N/A / N/A | |
| 55.7 | 54.0 | 40.0 | 38.9 | 32.4 | 37.5 | 40.0 | 20.0 | 75.0 | 100.0 | 30.0 | N/A | 40.0 | 0.0 | N/A | N/A | N/A | N/A | |
| 10.2 / 17.2 | 4.5 / 7.5 | 3.8 / 6.8 | 1.2 / 4.2 | 0.2 / 1.0 | 1.5 / 3.2 | 3.5 / 6.0 | 0.2 / 1.0 | 0.0 / 0.5 | 1.0 / 1.0 | 1.0 / 2.3 | 0.0 / 0.0 | 0.3 / 0.7 | 0.0 / 0.5 | N/A / N/A | N/A / N/A | N/A / N/A | N/A / N/A | |
| 59.4 | 60.0 | 55.6 | 29.4 | 25.0 | 46.2 | 58.3 | 25.0 | 0.0 | 100.0 | 42.9 | N/A | 50.0 | 0.0 | N/A | N/A | N/A | N/A | |
| 0.8 / 2.5 | 2.2 / 5.0 | 0.8 / 4.5 | 2.2 / 4.8 | 2.8 / 8.2 | 0.8 / 2.8 | 0.5 / 4.0 | 1.0 / 5.2 | 1.5 / 1.5 | 0.5 / 0.5 | 0.0 / 1.0 | 0.0 / 0.0 | 0.3 / 1.0 | 0.0 / 1.0 | N/A / N/A | N/A / N/A | N/A / N/A | N/A / N/A | |
| 30.0 | 45.0 | 16.7 | 47.4 | 33.3 | 27.3 | 12.5 | 19.0 | 100.0 | 100.0 | 0.0 | N/A | 33.3 | 0.0 | N/A | N/A | N/A | N/A | |
| 5.8 / 9.2 | 2.2 / 3.0 | 2.0 / 3.2 | 1.0 / 1.2 | 0.2 / 0.2 | 3.8 / 4.0 | 0.2 / 0.2 | 1.8 / 2.8 | 0.0 / 0.0 | 0.0 / 0.0 | 1.0 / 1.3 | 2.0 / 2.0 | 0.0 / 0.0 | 0.0 / 0.0 | N/A / N/A | N/A / N/A | N/A / N/A | N/A / N/A | |
| 62.2 | 75.0 | 61.5 | 80.0 | 100.0 | 93.8 | 100.0 | 63.6 | N/A | N/A | 75.0 | 100.0 | N/A | N/A | N/A | N/A | N/A | N/A | |
| 3.8 | 0.0 | 2.2 | 1.0 | 0.0 | 0.5 | 1.5 | 0.2 | 0.0 | 0.0 | 1.0 | 0.0 | 0.0 | 0.0 | N/A | N/A | N/A | N/A | |
| 5.8 | 0.8 | 5.0 | 7.0 | 1.8 | 2.5 | 2.0 | 2.2 | 1.0 | 0.5 | 2.3 | 1.0 | 0.3 | 0.5 | N/A | N/A | N/A | N/A | |
| 59.8 | 65.1 | 46.3 | 53.7 | 48.1 | 58.0 | 43.3 | 35.2 | 112.5 | 116.7 | 38.3 | 113.6 | 50.0 | 0.0 | N/A | N/A | N/A | N/A | |
| 57.6 | 63.0 | 43.3 | 51.4 | 47.3 | 43.8 | 42.5 | 28.0 | 112.5 | 116.7 | 30.0 | N/A | 50.0 | 0.0 | N/A | N/A | N/A | N/A | |
| 1.43 | 2.33 | 1.75 | 0.83 | 1.00 | 4.33 | 1.25 | 1.00 | 2.00 | N/A | 1.50 | 0.00 | N/A | N/A | N/A | N/A | N/A | N/A | |
| 12.8 | 17.8 | 13.6 | 13.6 | 7.4 | 8.8 | 9.0 | 9.1 | 20.0 | 0.0 | 14.5 | 36.2 | 0.0 | 0.0 | N/A | N/A | N/A | N/A | |
| 46.8 | 24.0 | 28.9 | 13.9 | 2.7 | 66.7 | 2.5 | 44.0 | 0.0 | 0.0 | 40.0 | N/A | 0.0 | 0.0 | N/A | N/A | N/A | N/A | |
| 12.7 | 40.0 | 40.0 | 52.8 | 89.2 | 45.8 | 40.0 | 84.0 | 75.0 | 33.3 | 30.0 | N/A | 60.0 | 66.7 | N/A | N/A | N/A | N/A |
2026-27 regular season. Current roster membership; statistics include all team stops.
Scroll sideways for all players. Select a stat label to sort. Shooting cells show made / attempted, sorted by makes.
Per game. Per 36 rescales counting stats using total minutes; MIN stays minutes per appearance, GP stays appearances and rates stay unchanged. Percentages use pooled attempts. N/A means unavailable, not zero.
No appearances or unavailable data: Tre Donaldson, Vladislav Goldin, Keshad Johnson, Jahmir Young.
+/− is the observed team scoring margin while the player was on court, not an individual impact rating.
| Player | Andrew WigginsSF | Bam AdebayoC | Bobby PortisC | Davion MitchellPG | Dru SmithSG | Giannis AntetokounmpoPF | Jahmir YoungPG | Keshad JohnsonSF | Klay ThompsonSF | Myron GardnerSF | Nick RichardsC | Nikola JovićPF | Pelle LarssonSG | Ryan Conwell | Simone FontecchioSF | Tim Hardaway Jr.SG | Tre Donaldson | Vladislav GoldinC |
|---|---|---|---|---|---|---|---|---|---|---|---|---|---|---|---|---|---|---|
| N/A | N/A | N/A | N/A | N/A | N/A | N/A | N/A | N/A | N/A | N/A | N/A | N/A | N/A | N/A | N/A | N/A | N/A | |
| N/A | N/A | N/A | N/A | N/A | N/A | N/A | N/A | N/A | N/A | N/A | N/A | N/A | N/A | N/A | N/A | N/A | N/A | |
| N/A | N/A | N/A | N/A | N/A | N/A | N/A | N/A | N/A | N/A | N/A | N/A | N/A | N/A | N/A | N/A | N/A | N/A | |
| N/A | N/A | N/A | N/A | N/A | N/A | N/A | N/A | N/A | N/A | N/A | N/A | N/A | N/A | N/A | N/A | N/A | N/A | |
| N/A | N/A | N/A | N/A | N/A | N/A | N/A | N/A | N/A | N/A | N/A | N/A | N/A | N/A | N/A | N/A | N/A | N/A | |
| N/A | N/A | N/A | N/A | N/A | N/A | N/A | N/A | N/A | N/A | N/A | N/A | N/A | N/A | N/A | N/A | N/A | N/A | |
| N/A | N/A | N/A | N/A | N/A | N/A | N/A | N/A | N/A | N/A | N/A | N/A | N/A | N/A | N/A | N/A | N/A | N/A | |
| N/A | N/A | N/A | N/A | N/A | N/A | N/A | N/A | N/A | N/A | N/A | N/A | N/A | N/A | N/A | N/A | N/A | N/A | |
| N/A | N/A | N/A | N/A | N/A | N/A | N/A | N/A | N/A | N/A | N/A | N/A | N/A | N/A | N/A | N/A | N/A | N/A | |
| N/A | N/A | N/A | N/A | N/A | N/A | N/A | N/A | N/A | N/A | N/A | N/A | N/A | N/A | N/A | N/A | N/A | N/A | |
| N/A / N/A | N/A / N/A | N/A / N/A | N/A / N/A | N/A / N/A | N/A / N/A | N/A / N/A | N/A / N/A | N/A / N/A | N/A / N/A | N/A / N/A | N/A / N/A | N/A / N/A | N/A / N/A | N/A / N/A | N/A / N/A | N/A / N/A | N/A / N/A | |
| N/A | N/A | N/A | N/A | N/A | N/A | N/A | N/A | N/A | N/A | N/A | N/A | N/A | N/A | N/A | N/A | N/A | N/A | |
| N/A | N/A | N/A | N/A | N/A | N/A | N/A | N/A | N/A | N/A | N/A | N/A | N/A | N/A | N/A | N/A | N/A | N/A | |
| N/A | N/A | N/A | N/A | N/A | N/A | N/A | N/A | N/A | N/A | N/A | N/A | N/A | N/A | N/A | N/A | N/A | N/A | |
| N/A | N/A | N/A | N/A | N/A | N/A | N/A | N/A | N/A | N/A | N/A | N/A | N/A | N/A | N/A | N/A | N/A | N/A | |
| N/A | N/A | N/A | N/A | N/A | N/A | N/A | N/A | N/A | N/A | N/A | N/A | N/A | N/A | N/A | N/A | N/A | N/A | |
| N/A | N/A | N/A | N/A | N/A | N/A | N/A | N/A | N/A | N/A | N/A | N/A | N/A | N/A | N/A | N/A | N/A | N/A | |
| N/A | N/A | N/A | N/A | N/A | N/A | N/A | N/A | N/A | N/A | N/A | N/A | N/A | N/A | N/A | N/A | N/A | N/A | |
| N/A | N/A | N/A | N/A | N/A | N/A | N/A | N/A | N/A | N/A | N/A | N/A | N/A | N/A | N/A | N/A | N/A | N/A | |
| N/A | N/A | N/A | N/A | N/A | N/A | N/A | N/A | N/A | N/A | N/A | N/A | N/A | N/A | N/A | N/A | N/A | N/A |
2026-27 playoffs. Current roster membership; statistics include all team stops.
Scroll sideways for all players. Select a stat label to sort. Shooting cells show made / attempted, sorted by makes.
Per game. Per 36 rescales counting stats using total minutes; MIN stays minutes per appearance, GP stays appearances and rates stay unchanged. Percentages use pooled attempts. N/A means unavailable, not zero.
No appearances or unavailable data: Bam Adebayo, Giannis Antetokounmpo, Ryan Conwell, Tre Donaldson, Simone Fontecchio, Myron Gardner, Vladislav Goldin, Tim Hardaway Jr., Keshad Johnson, Nikola Jović, Pelle Larsson, Davion Mitchell, Bobby Portis, Nick Richards, Dru Smith, Klay Thompson, Andrew Wiggins, Jahmir Young.
+/− is the observed team scoring margin while the player was on court, not an individual impact rating.
| Player | Giannis AntetokounmpoPF | Davion MitchellPG | Bobby PortisC | Bam AdebayoC | Andrew WigginsSF | Pelle LarssonSG | Klay ThompsonSF | Tim Hardaway Jr.SG | Nick RichardsC | Keshad JohnsonSF | Simone FontecchioSF | Dru SmithSG | Myron GardnerSF | Nikola JovićPF | Ryan Conwell | Jahmir YoungPG | Vladislav GoldinC | Tre Donaldson |
|---|---|---|---|---|---|---|---|---|---|---|---|---|---|---|---|---|---|---|
| 26.8 | 16.9 | 14.4 | 14.3 | 12.7 | 11.7 | 10.0 | 8.6 | 8.0 | 6.5 | 5.3 | 3.8 | 3.0 | 2.7 | 1.7 | 1.5 | 0.8 | N/A | |
| 8.9 | 1.9 | 7.4 | 8.2 | 3.4 | 3.2 | 1.5 | 3.0 | 5.6 | 2.2 | 1.7 | 1.5 | 1.2 | 1.7 | 0.3 | 0.3 | 1.0 | N/A | |
| 4.8 | 6.5 | 1.6 | 4.4 | 2.1 | 3.5 | 1.5 | 0.8 | 0.5 | 0.6 | 0.8 | 1.9 | 0.8 | 0.9 | 0.7 | 0.6 | 0.3 | N/A | |
| 29.0 | 33.6 | 25.2 | 30.0 | 27.6 | 29.1 | 20.0 | 21.6 | 18.4 | 11.8 | 9.1 | 11.4 | 6.8 | 11.0 | 3.2 | 4.1 | 2.7 | N/A | |
| 10 | 10 | 10 | 10 | 10 | 10 | 10 | 10 | 10 | 10 | 10 | 10 | 10 | 10 | 3 | 10 | 9 | N/A | |
| 1.1 | 0.7 | 1.2 | 1.6 | 0.5 | 1.1 | 0.2 | 0.6 | 0.0 | 1.0 | 0.4 | 0.7 | 0.2 | 0.3 | 0.0 | 0.1 | 0.0 | N/A | |
| 0.4 | 0.4 | 0.3 | 0.7 | 0.4 | 0.2 | 0.4 | 0.4 | 0.6 | 0.4 | 0.2 | 0.1 | 0.4 | 0.3 | 0.0 | 0.0 | 0.3 | N/A | |
| 2.9 | 1.8 | 1.0 | 1.3 | 1.3 | 1.6 | 0.8 | 0.7 | 0.9 | 0.4 | 0.3 | 0.7 | 0.6 | 0.3 | 0.0 | 0.2 | 0.3 | N/A | |
| 2.2 | 2.4 | 1.6 | 1.4 | 2.1 | 2.5 | 1.6 | 1.6 | 1.9 | 1.1 | 0.9 | 1.6 | 1.8 | 0.9 | 0.3 | 0.4 | 0.6 | N/A | |
| -7.5 | -6.4 | -2.9 | -0.8 | -5.9 | +0.2 | -6.3 | +0.1 | -1.7 | +5.0 | -0.2 | -4.3 | +0.3 | -4.3 | -0.7 | +1.5 | +0.6 | N/A | |
| 10.3 / 19.0 | 6.8 / 12.4 | 5.5 / 12.9 | 5.3 / 11.3 | 4.7 / 10.3 | 3.8 / 8.4 | 3.4 / 10.3 | 2.4 / 7.0 | 3.2 / 5.9 | 2.6 / 4.4 | 1.7 / 3.6 | 1.5 / 2.9 | 1.0 / 1.9 | 1.0 / 3.5 | 0.7 / 1.7 | 0.6 / 1.5 | 0.3 / 0.4 | N/A / N/A | |
| 54.2 | 54.8 | 42.6 | 46.9 | 45.6 | 45.2 | 33.0 | 34.3 | 54.2 | 59.1 | 47.2 | 51.7 | 52.6 | 28.6 | 40.0 | 40.0 | 75.0 | N/A | |
| 10.0 / 17.3 | 4.5 / 7.2 | 3.1 / 7.5 | 4.1 / 7.0 | 3.0 / 5.5 | 2.9 / 5.4 | 0.8 / 2.1 | 1.2 / 2.6 | 2.8 / 4.9 | 2.1 / 2.4 | 0.5 / 1.1 | 1.1 / 1.8 | 0.6 / 0.8 | 0.8 / 1.6 | 0.3 / 0.7 | 0.5 / 1.0 | 0.3 / 0.4 | N/A / N/A | |
| 57.8 | 62.5 | 41.3 | 58.6 | 54.5 | 53.7 | 38.1 | 46.2 | 57.1 | 87.5 | 45.5 | 61.1 | 75.0 | 50.0 | 50.0 | 50.0 | 75.0 | N/A | |
| 0.3 / 1.7 | 2.3 / 5.2 | 2.4 / 5.4 | 1.2 / 4.3 | 1.7 / 4.8 | 0.9 / 3.0 | 2.6 / 8.2 | 1.2 / 4.4 | 0.4 / 1.0 | 0.5 / 2.0 | 1.2 / 2.5 | 0.4 / 1.1 | 0.4 / 1.1 | 0.2 / 1.9 | 0.3 / 1.0 | 0.1 / 0.5 | 0.0 / 0.0 | N/A / N/A | |
| 17.6 | 44.2 | 44.4 | 27.9 | 35.4 | 30.0 | 31.7 | 27.3 | 40.0 | 25.0 | 48.0 | 36.4 | 36.4 | 10.5 | 33.3 | 20.0 | N/A | N/A | |
| 5.9 / 9.6 | 1.0 / 1.6 | 1.0 / 1.5 | 2.5 / 3.4 | 1.6 / 2.0 | 3.2 / 3.9 | 0.6 / 0.6 | 2.6 / 3.5 | 1.2 / 2.0 | 0.8 / 1.2 | 0.7 / 0.8 | 0.4 / 0.5 | 0.6 / 0.7 | 0.5 / 1.0 | 0.0 / 0.0 | 0.2 / 0.2 | 0.1 / 0.1 | N/A / N/A | |
| 61.5 | 62.5 | 66.7 | 73.5 | 80.0 | 82.1 | 100.0 | 74.3 | 60.0 | 66.7 | 87.5 | 80.0 | 85.7 | 50.0 | N/A | 100.0 | 100.0 | N/A | |
| 2.9 | 0.4 | 1.3 | 1.6 | 1.5 | 0.6 | 0.1 | 0.7 | 1.4 | 1.1 | 0.5 | 0.7 | 0.3 | 0.5 | 0.0 | 0.2 | 0.3 | N/A | |
| 6.0 | 1.5 | 6.1 | 6.6 | 1.9 | 2.6 | 1.4 | 2.3 | 4.2 | 1.1 | 1.2 | 0.8 | 0.9 | 1.2 | 0.3 | 0.1 | 0.7 | N/A | |
| 57.7 | 64.5 | 53.1 | 55.9 | 56.8 | 57.8 | 47.3 | 50.4 | 59.0 | 65.9 | 67.1 | 60.9 | 67.9 | 34.3 | 50.0 | 47.2 | 78.8 | N/A | |
| 55.0 | 64.1 | 51.9 | 52.2 | 53.9 | 50.6 | 45.6 | 42.9 | 57.6 | 64.8 | 63.9 | 58.6 | 63.2 | 31.4 | 50.0 | 43.3 | 75.0 | N/A | |
| 1.66 | 3.61 | 1.60 | 3.38 | 1.62 | 2.19 | 1.88 | 1.14 | 0.56 | 1.50 | 2.67 | 2.71 | 1.33 | 3.00 | N/A | 3.00 | 1.00 | N/A | |
| 11.1 | 12.1 | 6.9 | 9.2 | 10.4 | 13.7 | 7.0 | 7.6 | 11.7 | 7.5 | 7.1 | 18.3 | 21.4 | 7.1 | 0.0 | 11.2 | 40.3 | N/A | |
| 50.5 | 12.9 | 11.6 | 30.1 | 19.4 | 46.4 | 5.8 | 50.0 | 33.9 | 27.3 | 22.2 | 17.2 | 36.8 | 28.6 | 0.0 | 13.3 | 25.0 | N/A | |
| 8.9 | 41.9 | 41.9 | 38.1 | 46.6 | 35.7 | 79.6 | 62.9 | 16.9 | 45.5 | 69.4 | 37.9 | 57.9 | 54.3 | 60.0 | 33.3 | 0.0 | N/A |
Each player’s latest ten appearances, including playoffs and previous seasons. Current roster membership; statistics include all team stops.
Scroll sideways for all players. Select a stat label to sort. Shooting cells show made / attempted, sorted by makes.
Per game. Per 36 rescales counting stats using total minutes; MIN stays minutes per appearance, GP stays appearances and rates stay unchanged. Percentages use pooled attempts. N/A means unavailable, not zero.
No appearances or unavailable data: Tre Donaldson.
+/− is the observed team scoring margin while the player was on court, not an individual impact rating.
Behind the ratings
Scoring production
Shots & points conceded
Counts per 100 possessions. Makes and attempts are grouped by shot type. Shot-volume ranks describe frequency, not quality; points allowed rank lowest first.
Accuracy & foul pressure
Opponent accuracy & foul pressure
FT rate measures attempts drawn or conceded relative to field-goal attempts. Defense excludes opponent FTM, FT% and TS% so free-throw conversion does not drive its shooting profile.
Creation & possession control
Disruption, rebounds & discipline
Offensive counts use team possessions; defensive counts use opponent possessions. AST% is assisted field goals; ORB% and DRB% measure available boards. Steals are part of forced turnovers, not extra possessions to add together.
2026-27 · 4 regular-season games · 30-team comparison
Scoring production
Shots & points conceded
Counts per 100 possessions. Makes and attempts are grouped by shot type. Shot-volume ranks describe frequency, not quality; points allowed rank lowest first.
Accuracy & foul pressure
Opponent accuracy & foul pressure
FT rate measures attempts drawn or conceded relative to field-goal attempts. Defense excludes opponent FTM, FT% and TS% so free-throw conversion does not drive its shooting profile.
Creation & possession control
Disruption, rebounds & discipline
Offensive counts use team possessions; defensive counts use opponent possessions. AST% is assisted field goals; ORB% and DRB% measure available boards. Steals are part of forced turnovers, not extra possessions to add together.
10 latest games · Apr 04 to Oct 26, 2026 · Each of 30 teams compared over its own latest 10
Focused axes show their minimum and maximum; the centre is not necessarily zero. Hover, focus or tap a trace for its value, rank and ranking direction. Ranks compare teams in the selected sample. League values average team rates. A larger radar is not always better.
Not affiliated with, endorsed by, or sponsored by the NBA.