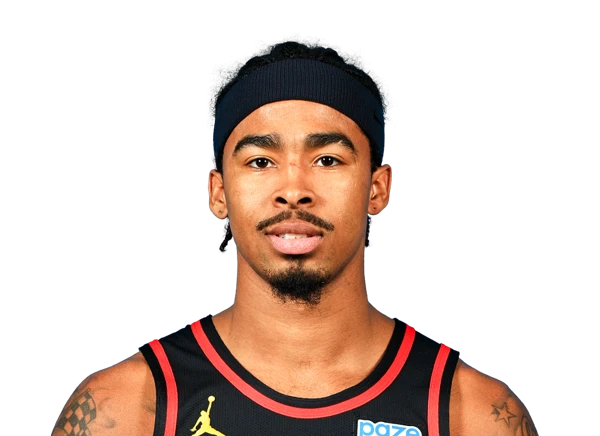
Explore this player’s complete projections in the full-game view.
Performance
Season & recent form
2026-27 · 0 regular-season gamesPer game
PTS
N/A
REB
N/A
AST
N/A
MIN
N/A
Box score
Stat Avg.Stat Avg.
ORB
N/A
DRB
N/A
STL
N/A
BLK
N/A
TOV
N/A
FLS
N/A
+/-
N/A
Shooting
Shot
Made
Att.
%
FG
N/A
N/A
N/A
2P
N/A
N/A
N/A
3P
N/A
N/A
N/A
FT
N/A
N/A
N/A
Feb 7, 2026 to Apr 12, 2026 · 4 appearances · includes playoffsPer game
PTS
4.2
REB
1.2
AST
3.0
MIN
18.4
Box score
Stat Avg.Stat Avg.
ORB
0.5
DRB
0.8
STL
0.8
BLK
1.0
TOV
2.0
FLS
1.2
+/-
-14.5
Shooting
Shot
Made
Att.
%
FG
1.2
3.0
41.7%
2P
1.2
2.2
55.6%
3P
0.0
0.8
0.0%
FT
1.8
1.8
100.0%
Explore the numbers
Player profile
Shot chart
Recorded shot locations are unavailable for this sample.
12 recorded attempts
Relative concentration
LowHigh
One dot per recorded shot
A verified league comparison is unavailable for this sample.
Stat profile
Keshon Gilbert
Normalize
Loading chart…
Share of attempts · 2026-27 regular season + playoffs. Attempt-weighted comparisons. Each axis uses its own actual-unit scale, focused on the compared values; the centre is not necessarily zero. No usable league references; independent scales shown. Hover, focus or tap a trace for its value.
Loading chart…
2026-27 regular season. Shooting percentages from pooled totals. 0 league players / N/A PGs; 20 games, 500 minutes minimum. Each axis uses its own actual-unit scale, focused on the compared values; the centre is not necessarily zero. No usable league references; independent scales shown. Hover, focus or tap a trace for its value.
Loading chart…
2026-27 regular season. Per 36 minutes, using exact playing time. Comparisons use pooled counts / minutes. 0 league players / N/A PGs; 20 games, 500 minutes minimum. Each axis uses its own actual-unit scale, focused on the compared values; the centre is not necessarily zero. No usable league references; independent scales shown. Hover, focus or tap a trace for its value.
Latest 4 appearances · 2026-02-07 to 2026-04-12. Season league and position references. Share of attempts. Each axis uses its own actual-unit scale, focused on the compared values; the centre is not necessarily zero. No usable league references; independent scales shown. Hover, focus or tap a trace for its value.
Loading chart…
Latest 4 appearances · 2026-02-07 to 2026-04-12. Season league and position references. Shooting percentages from pooled totals. Each axis uses its own actual-unit scale, focused on the compared values; the centre is not necessarily zero. No usable league references; independent scales shown. Hover, focus or tap a trace for its value.
Loading chart…
Latest 4 appearances · 2026-02-07 to 2026-04-12. Season league and position references. Per 36 minutes, using exact playing time. Each axis uses its own actual-unit scale, focused on the compared values; the centre is not necessarily zero. No usable league references; independent scales shown. Hover, focus or tap a trace for its value.
Season locations and shot-zone shares: 2026-27 regular season + playoffs. Season box scores: 2026-27 regular season. Playoffs uses playoff appearances and playoff comparisons only. Last 10 includes playoffs and can span seasons. More turnovers or fouls is not better.
Not affiliated with, endorsed by, or sponsored by the NBA.